Are Wisconsin lakes warming?
Published:
Concerns about changing water temperatures have become prevalent as air temperatures increase globally. In WI, the North Temperate Lakes Long-Term Ecological Research (NTL-LTER) program at the University of Wisconsin-Madison monitors the attributes of 11 lakes including lakes from northern and southern Wisconsin. This report uses data from the 11 lakes monitored by the NTL-LTER to assess if lakes are warming over time, how warming by season compares to overall warming, if inter-annual temperature patterns are the same between the Northern and southern lakes and if the date when lake ice melts is associated with summer water temperatures. In collaboration with researchers from the limnology department at the University of Wisconsin-Madison, the report aims to assist researchers in understanding how WI lake temperatures are changing to better understand the effects of climate change on Wisconsin lakes.
Data
Two separate datasets were provided by NTL-LTER containing temperature and ice-off data on 11 Wisconsin lakes: 4 lakes from southern Wisconsin and 7 lakes from northern Wisconsin. One lake, identified as lake “LR,” was removed. The temperature for each lake at different lake layers was computed by defining the surface as the two shallowest depths, the bottom as the two deepest depths, and the average as the temperature over all depths for each sample collected in each lake. The datasets were joined by lake identification and year. A region and season identifier was added. Due to inconsistency in data collection of temperature and ice-off data, 7 lakes contain temperature data from 1981, 2 from 1995, and 2 from 1996, the last year of temperature data is 2022. The earliest data available for ice-off data is for 1981 and the latest is for 2023. To account for no data collection on some years and the different data starting points of each lake a relative year variable was created. Only data between 1996 and 2022 was considered, and the relative year variable considers the years from 1996.
Are WI lakes getting warmer over time?
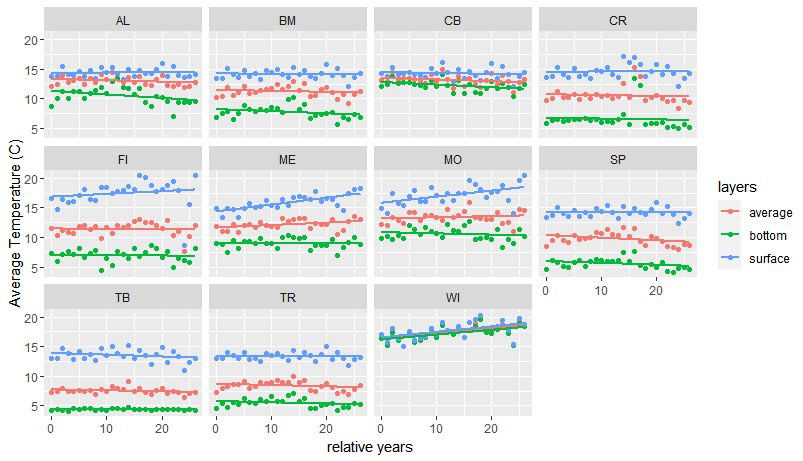
To assess if Wisconsin lake temperatures are warming over time the average lake temperature was explored for the relative year of each lake and layer. Figure 1 shows a positive trend from the initial sample years for some lakes and minimal differences for others. As expected there are noticeable differences in the average temperature for each layer. The average temperature for each layer from 1996 to 2022 across lakes is \(15.1^{\circ}C, 11.6^{\circ}C, 8.65^{\circ}C\), for the surface, average, and bottom depth layers, respectively. The average temperature across all lakes ranged from \(0.05^{\circ}C\) to \(29.75^{\circ}C\).
A linear mixed effects model was fitted with lake layers and relative years as a fixed effect and water temperature as a response. To account for the variation between each lake, the lakes were treated as random effects. The results from our model show that after controlling for the lake layers the expected average water temperature increases by \(0.013^{\circ}C\) for each additional year relative to 1996 across all lakes. Moreover, our model suggests evidence of differences in the expected average water temperature between the lake layers, across all lakes, after adjusting for relative years. Table 1 summarizes the estimated effects for the fixed effects in our model. The estimated variance for the lakes is 6.619.
## How does temparature differ relative to overall warming?
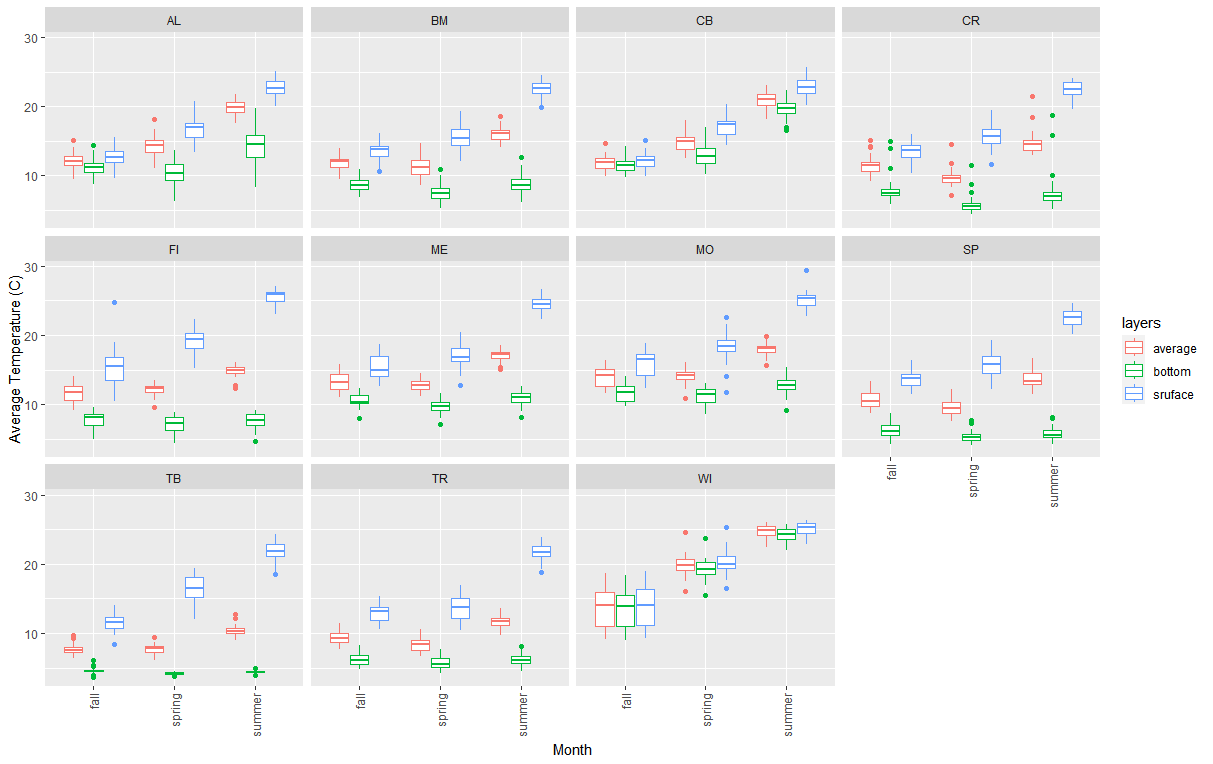
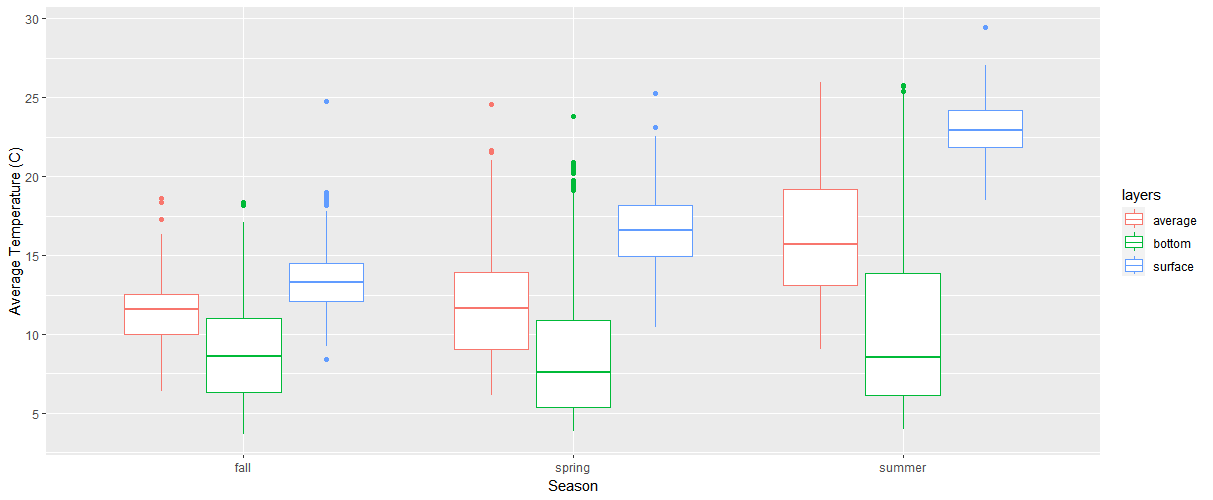
A seasonal variable was created to compare warming by season to overall warming. Summer was considered the months from July to August, fall from September to November, and spring from May to June. Winter was not considered and ignored as the lakes were covered in ice, and minimal data to no data was obtained for these months compared to other seasons. The average temperature across all lakes for each of the seasons is \($11.5^{\circ}C\), \(12.7^{\circ}C\), and \(17.0^{\circ}C\), in the fall, spring, and summer, respectively. Differences in the average temperature by season and lake layers can be seen in figure 5. Table 2 displays the average temperatures for each layer. Figure 2 shows the differences in the average temperature of each season for each lake and lake layer across the relative years from 1996.
A linear mixed effects model was fitted with average temperature as a response, and season, lake layers, and relative years were treated as fixed effects. To account for the variability between the lakes, the lakes were treated as a random effect. From our model, after controlling for relative years, and lake layers, the expected average temperature across all lakes is \(1.01^{\circ}C\) higher in the spring relative to fall. Similarly, the expected average temperature across all lakes is \(5.37^{\circ}C\) higher in the summer compared to fall. The estimated variance for lakes is 7.26. Table 3 summarizes the variable estimates for the fixed effects in our model.
## How to temperatures differ between North and South Wisconsin lake regions?
To explore inter-annual temperature patterns between Northern and Southern Wisconsin lake regions, again winter data was removed so as to incorporate an estimated season effect. The average temperature in each region shows some differences. The average temperature is \(10.6^{\circ}C\), and \(13.9^{\circ}C\) for the Northern and Southern regions across all lakes, respectively. The average temperature range is \(2.9^{\circ}C\) to \(27.4^{\circ}C\) and \(0.85^{\circ}C\) to \(29.8^{\circ}C\) for Northern and Southern Regions respectively. Figure 3. shows similarities in the average temperature when grouped by region, layers, and relative years from 1996.
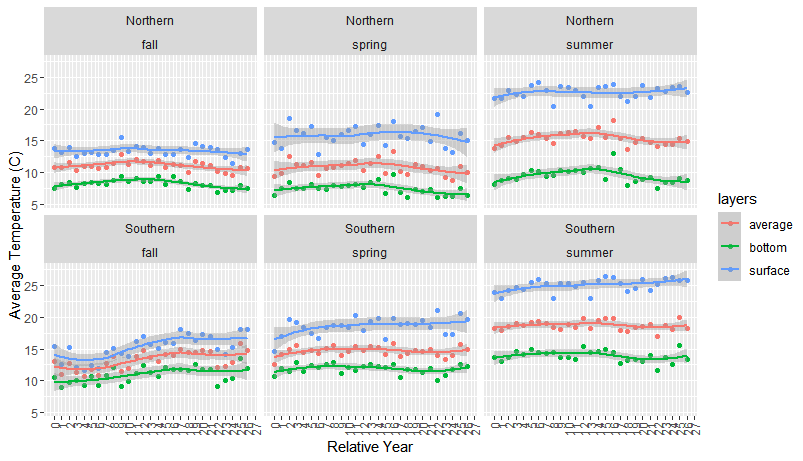
A linear mixed effects model with a random effect for each lake was fitted with fixed effects for the relative years, seasons, layers, and regions. From our model, the expected average temperature is \(3.07^{\circ}C\) higher for southern region lakes than northern lakes, after adjusting for layers, seasons, and years relative to 1996. Table 4 summarizes the fixed effects in the model. The estimated variance for the lake random effect is 5.39.
Are ice melt dates associated with summer water temperatures?
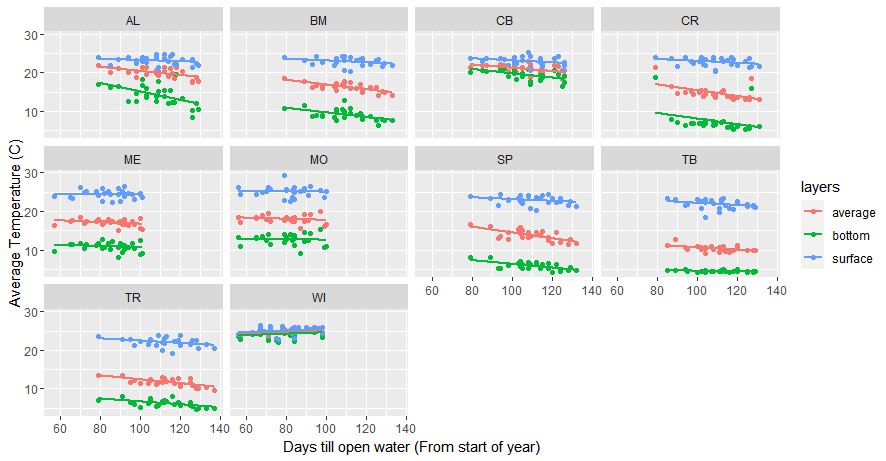
To assess if ice melt dates are associated with summer water temperatures the data for summer was separately considered. The average temperature among all samples, years, and lakes from 1996 to 2022 is \(17.1^{\circ}C\), with a standard error of 6.65, the max temperature is \(29.5^{\circ}C\), and the minimum temperature is \(3.9^{\circ}C\). The average temperature is \(16.7^{\circ}C, 11.4^{\circ}C\) and \(23.3^{\circ}C\) for the average, bottom, and surface, respectively. The date the lake was open water in the spring was used to create a variable for the number of days since the start of the year. Figure 4 shows a negative correlation between the number of days till open water and the average temperature for each lake layer. Figure 6 shows differences in the relationship between average temperature and the number of days till open water between each lake.
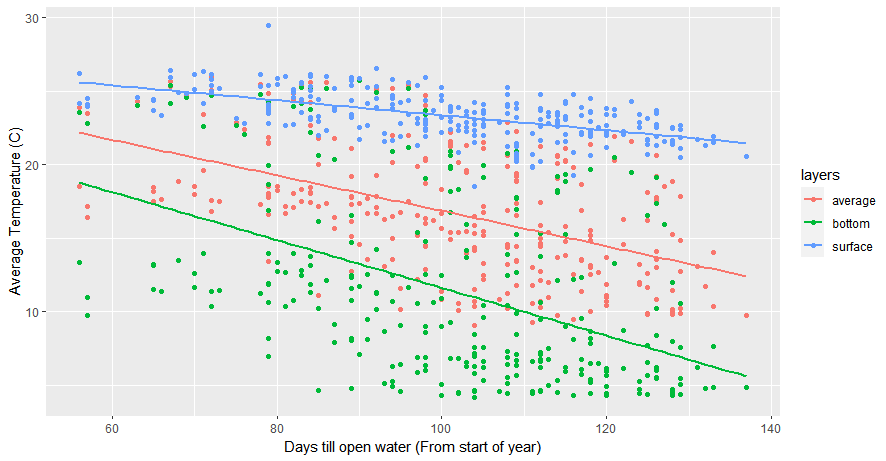
To account for the variation between each lake, a linear mixed effects model was fitted with the number of days till open water as a fixed effect, lakes as a random effect, and the average temperature as the response. From our model, the expected average temperature across all lakes is negatively associated with the number of days till open water from the start of the year. The estimated variance for lakes is 11.86. Table 5 summarizes the estimates from our model.
Results
From our models, we find evidence to suggest warming in Wisconsin lakes, differences in warming by season compared to overall warming, differences in the inter-annual temperature patterns between northern and southern Wisconsin lakes, and a negative correlation between the expected summer average water temperatures and the days till open water from the start of the year. In particular, we find the expected average across all lakes increases by \(0.007^{\circ}C\) for each additional year since 1996, after controlling for layers, seasons, and regions. The expected average temperature is \(1.01^{\circ}C\) higher in the spring compared to the fall after adjusting for relative years, layers, and regions. Likewise, the expected average temperature is \(5.38^{\circ}C\) higher in the spring compared to the fall after adjusting for relative year, layers, and region. After controlling for seasons, layers, and relative years, the expected average temperature is \(3.078^{\circ}C\) higher for the Southern region than the Northern Region lakes. In assessing the association between summer temperatures and open-water dates, our model suggests the expected average temperature decreases by \(0.04^{\circ}C\) for each additional day till open water from the start of the year, across all lakes.
Discussion
The results from our model suggest warming across Wisconsin lakes over time and suggest changes in lake ecosystems. Further research, should incorporate interactions between the predictors used and consider other lake factors such as water levels and biodiversity to understand how warming is causing changes in other lake aspects apart from water temperature. Some limitations to consider when interpreting the results is the different samples gathered for each lake vary across months and years. Our analysis only considered data for the years 1996-2022, as each lake contained data for 1996 to 2022, however, the samples gathered for each of the lakes are different between some lakes. Further analysis, may consider applying weighted regression to apply a higher weight to observations from lakes with a smaller number of observations or an equal sampling effort could be applied to incorporate a more balanced design. Of note is that lakes varied in depth, with some lakes being remarkably shallower or deeper than others, a layers variable was created to assess temperatures at different depths, but for lakes, it is known that the metalimnion (middle) lake layers are dependent on the thermocline. A better measure that defines the middle layer using temperature changes should be explored.
## Appendix
| Variable | Estimate | Std. Error | t value |
|---|---|---|---|
| Intercept | 11.400934 | 0.782 | 14.576 |
| relative year | 0.013 | 0.003 | 3.393 |
| bottom | -2.907 | 0.103 | -28.173 |
| surface | 3.447 | 0.103 | 33.405 |
Table 1.: Fixed effect estimates for change in average temperature by layer and relative year model with lakes as a random effect.
| Season | Layers | Mean Temp. | Std. Dev. Temp |
|---|---|---|---|
| Fall | Average Depth | 11.2 | 4.23 |
| Fall | Bottom Depth | 8.56 | 3.97 |
| Fall | Surface Depth | 13.3 | 5.51 |
| Spring | Average Depth | 11.8 | 4.16 |
| Spring | Bottom Depth | 8.63 | 4.40 |
| Spring | Surface Depth | 16.6 | 4.90 |
| Summer | Average Depth | 16.2 | 4.12 |
| Summer | Bottom Depth | 10.7 | 5.92 |
| Summer | Surface Depth | 23.1 | 2.16 |
Table 2. Average temperature by season and lake layers across all lakes.
| Variable | Estimate | Std. Error | t value |
|---|---|---|---|
| Intercept | 11.295464 | 0.826092 | 13.673 |
| Relative Year | 0.006660 | 0.006814 | 0.978 |
| Bottom | -3.744253 | 0.129844 | -28.837 |
| Surface | 4.598135 | 0.129844 | 35.413 |
| Spring | 1.011504 | 0.129809 | 7.792 |
| Summer | 5.379906 | 0.129809 | 41.445 |
Table 3. Fixed effect estimates for model assessing warming by season.
| Variable | Estimate | Std. Error | t value |
|---|---|---|---|
| Intercept | 10.176 | 0.89 | 11.42 |
| Relative Year | 0.007 | 0.007 | 0.978 |
| Bottom | -3.744 | 0.129 | -28.837 |
| Surface | 4.598 | 0.129 | 35.413 |
| Spring | 1.01 | 0.129 | 7.793 |
| Summer | 5.380 | 0.129 | 41.45 |
| Southern | 3.078 | 1.460 | 2.108 |
Table 4. Fixed effects estimates for water temperature model by relative years, season, layers, and region.
| Variable | Estimate | Std. Error | t value |
|---|---|---|---|
| Intercept | 21.06893 | 1.92559 | 10.942 |
| Days Till Open Water | -0.03872 | 0.01558 | -2.485 |
Table 5. Fixed effect estimates for model assessing the association between open water dates and summer water temperatures.