
Predicting group stage advancement for the 2025 UEFA Women’s Championship with a bayesian binomial model.
Published:
The 2025 UEFA Women’s Championship will be held in Switzerland on July 2, 2025. To explore the probability that each team advances past the group stage and into the knockout stage, we begin by modeling the relationship between the current rankings of each team before the 2025 tournament on the probability of advancing past the group stage. We treat advancements as success and tournaments as cases, applying a binomial model with a logit link, and specify normal priors for each of the estimated coefficients.
Data
Data from the International Federation of Football (FIFA) and Wikipedia was obtained for each team participating in the 2025 UEFA Women’s Champions tournament. Only tournament data for UEFA tournaments since 2005 were included, including team rankings before each tournament and results from each tournament. Data was joined by team and year. For each team, the rate of advancing past the group stage and average rating prior to tournaments was computed.
| Team | Ranking | Tournaments | Advances | Advancing Rate | Mean Ranking |
|---|---|---|---|---|---|
| Belgium | 20 | 5 | 1 | 0.2 | 25.6 |
| Denmark | 12 | 5 | 2 | 0.4 | 11.2 |
| England | 4 | 5 | 3 | 0.6 | 8.6 |
| Finland | 25 | 5 | 2 | 0.4 | 22 |
| France | 11 | 5 | 4 | 0.8 | 4.8 |
| Germany | 3 | 5 | 5 | 1 | 2.2 |
| Iceland | 13 | 5 | 1 | 0.2 | 17.4 |
| Italy | 14 | 5 | 2 | 0.4 | 13.6 |
| Netherlands | 10 | 5 | 3 | 0.6 | 13 |
| Norway | 15 | 5 | 3 | 0.6 | 9 |
| Poland | 28 | 5 | 0 | 0 | 32.2 |
| Portugal | 22 | 5 | 0 | 0 | 37.2 |
| Spain | 2 | 5 | 3 | 0.6 | 15.6 |
| Sweden | 6 | 5 | 5 | 1 | 4.8 |
| Switzerland | 23 | 5 | 0 | 0 | 23.2 |
| Wales | 31 | 5 | 0 | 0 | 41.8 |
Table 1. shows the actual rate of advancing past the group stage is higher for some teams. In particular, the German and Swedish national teams have advanced past the group stage in each of the past five UEFA tournaments.
Probabilistic Model
To estimate the probability that each team advances past the group stage and into the knockout stage by treating each of the previous tournaments as “cases”, and “advancements” past the group stage as “successes”, we assume a binomial sampling model for the data. For our model, we let \(Y_i\) denote the number of group stage tournament advances. We let \(Y_i\) follow a binomial distribution, where \(n_i\) denotes the number of tournaments, and \(p_i\) denotes the advancement rate for team \(i\).
\[Y_i \sim \text{binomial}(n_i, p_i)\]As the true probability of advancing depends on several factors, including how well a team is performing, a logit link function is used to model \(p_i\) based on its current FIFA Women’s World ranking. In particular, I incorporate the following logit link to link the current world ranking to the probability of advancing.
\[\text{logit}(p_i) = \beta_0 + \beta_1 \times \text{current ranking}_i\]In the model for \(p_i\), \(\beta_1\) represents a baseline log-odds of a team advancing for a current ranking of 0, and \(\beta_1\) represents the estimated effect of the current rankings on the log-odds of advancing to the knockout stage. To incorporate our beliefs for \(\beta_0\), I placed a normal prior centered at 0, with a small variance of 0.5 on the belief that each team in the tournament has at least a 50% chance of advancing.
\(\beta_0 \sim \text{Normal}(0, 1)\) \(\beta_1 \sim \text{Normal}(-1, 5)\)
For \(\beta_1\), in the data, higher ranks indicate lower team performance, so lower ranks should have higher log odds of advancing. On this notion, I placed a normal prior centered at -1, and a moderately high variance of 5, to allow lower-ranked teams to have higher odds, but also allow for positive and negative values. Using the specified model above, I defined the model in rstan, and generated posterior samples for \(p_i\) using 4 chains and 10,000 iterations, and by taking the inverse of the logit function using posterior estimated coefficient values.
Evaluation and Results
To assess the fit and evaluate the simulations from our model, the effective sample size and the R hat values for each team’s posterior samples of \(p_i\), the probability of getting past the group stage, were examined. From our model, the effective sample size and the R hat for our samples for each team suggest signs of MCMC mixing and convergence. In particular, for each posterior estimate for \(p_i\), the R hat value was below 1.000 for all the teams, and the effective sample size was also reasonable and ranged from 6,500 - 21,834, indicating a large number of independent samples.
To further evaluate the estimates for \(p_i\) from our model, prior estimates were generated and Bayesian p-values were computed to compare the prior sample estimates for each team’s \(p_i\) to the actual advancement rate computed using each team’s results in previous tournaments. From the Bayesian p-values, our model greatly underestimates and overestimates the advancement rate for teams that had an advancement rate of 1 as they got past the group stage in all of the previous five tournaments, and for teams that did not get past any group stage in any of the tournaments.
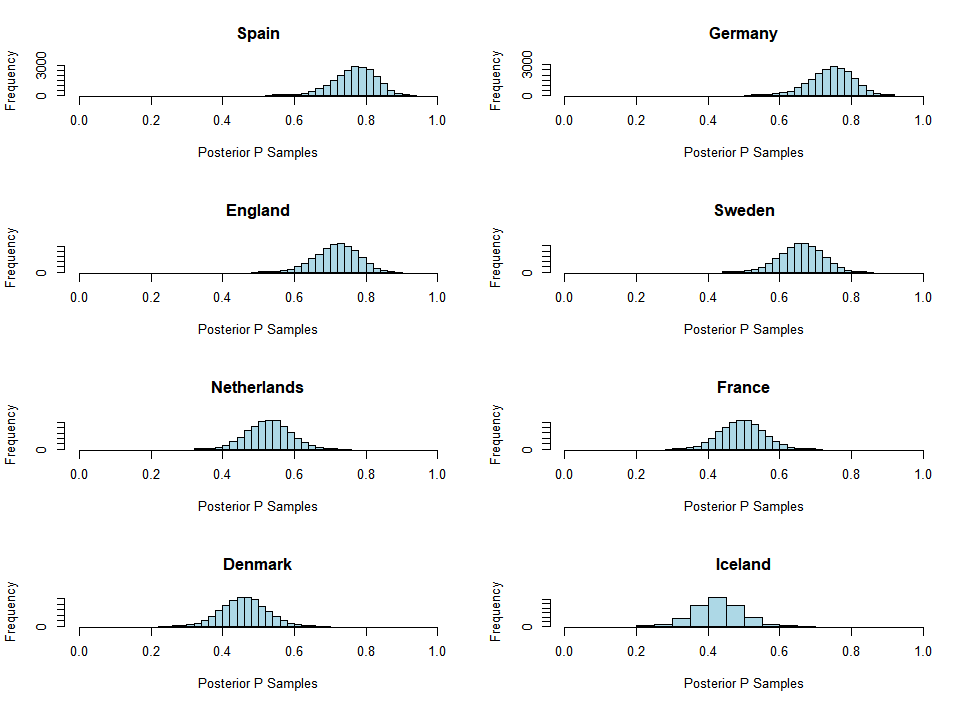
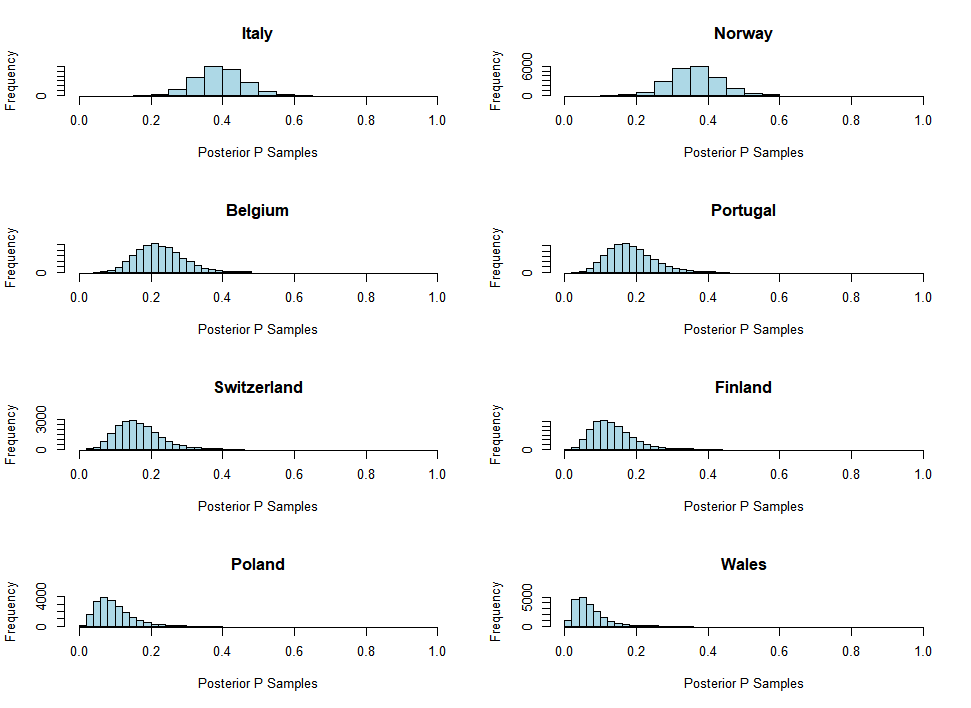
Posterior estimates were obtained using our observed data. The above figures display the posterior samples drawn from our model. Notably, the samples show that our estimate for the true probability of advancing past the group stage appears higher for teams with a lower ranking, and the probability decreases for higher-ranking teams, which is intuitively reasonable, as we assumed lower-ranked teams had a higher log odds. A point estimate and posterior credible interval for each team were computed. Table 1 shows the computed posterior point estimate and 95% confidence interval for the probability of advancing past the group stage. Under our assumed joint distribution, the estimated probability of advancing past the group stage is the highest for Spain and the lowest for Wales, 0.77 and 0.06, respectively.
Discussion and Limitations
The results from our model suggest that the lower-ranked teams have a higher probability of advancing past the group stage. In particular, the estimated probability of advancing past the group stage under our assumed distribution is the highest for Spain, Germany, and Sweden.
There are limitations to consider when interpreting our results, notably our model fails to include the grouping factor of the tournament. The UEFA tournament divides teams into four groups of four, and our model doesn’t incorporate this grouping factor. A hierarchical multilevel Bayesian logistic regression model that incorporates the grouping level of the tournament could be explored in future analysis. Before fitting the binomial model with a logit link to account for the current rankings of each team, I explored implementing a beta-binomial model and tried to add hyperpriors for a beta distribution before I settled for this simpler model. Another model aspect that was not incorporated but could be incorporated is the scoring aspect of the tournament is a Poisson model to incorporate the number of goals scored. Ultimately, since the data on Wikipedia didn’t have a variable for goals scored in each tournament by each team, I did not incorporate the scoring aspect, so further analysis could incorporate data from other websites to include team scoring into the model.
Appendix
| Team | Point Estimate | 95% Credible Interval |
|---|---|---|
| Spain | 0.77 | (0.65, 0.87) |
| Germany | 0.74 | (0.62, 0.84) |
| England | 0.72 | (0.60, 0.82) |
| Sweden | 0.66 | (0.54, 0.77) |
| Netherlands | 0.53 | (0.42, 0.64) |
| France | 0.49 | (0.38, 0.61) |
| Denmark | 0.46 | (0.35, 0.57) |
| Iceland | 0.43 | (0.31, 0.54) |
| Italy | 0.392 | (0.28, 0.51) |
| Norway | 0.36 | (0.25, 0.48) |
| Belgium | 0.22 | (0.12, 0.36) |
| Portugal | 0.181 | (0.08, 0.31) |
| Switzerland | 0.16 | (0.07, 0.29) |
| Finland | 0.13 | (0.05, 0.25) |
| Poland | 0.093 | (0.03, 0.20) |
| Wales | 0.066 | (0.02, 0.16) |
Table 1: Posterior point estimates and credible intervals for the probability of advancing past the group stage for each team in the UEFA tournament.
References
Johnson, Alicia, Miles Ott, and Mine Dogucu. Bayes Rules! An Introduction to Applied Bayesian Modeling. Chapman & Hall/CRC, 2022.
Baumer, Benjamin, et al. Bayesian Hierarchical Modeling. https://bayesball.github.io/BOOK/bayesian-hierarchical-modeling.html.
University of Wisconsin - Madison STAT 775, lecture notes.